Overview
Digital Operatives recently completed a DARPA Cyber Fast Track (CFT) contract called Process Attribution in Network Traffic (PAINT). The goal of this project was to build an easy-to-use software product capable of attributing originating and receiving Process IDs (PIDs) and Process Names for TCP/IP packets on a Windows system in real-time. We chose Wireshark as the implementation platform since it is very popular and one of the most useful open-source network analysis tools available today.
Our challenge in designing a packet-to-process attribution scheme was to take process-related metadata available at the TCP/IP layer and correlate it with discrete frames of network activity available at the bottom of the network stack (the NDIS layer). We considered several potential approaches to solving this problem, including implementing kernel-mode drivers, but we ultimately found that it was possible using a novel application of Event Tracing for Windows (ETW). Beginning with Windows 7, the various components in the network stack are able to generate trace messages via ETW that provide a way to collect correlated end-to-end network stack activity.
Motivation
We believe network traffic analysis and visualization are regarded as fundamental pillars of cyber defense. Wireshark is one of the most well-known and widely used network analysis tools. It’s useful for dynamic malware analysis and reverse engineering due to its powerful system of filters that allow the analyst to focus on network packets between selected hosts or using only certain protocols. However, due to the way it traces network traffic, it cannot determine the process on the host system that is responsible for sending or receiving that traffic. Thus, malware is able to hide its network communications semi-anonymously in the noise of legitimate network activity using similar protocols and data flow patterns. By PAINT-ing Wireshark, we are able to attribute all TCP/IP traffic to responsible processes and allow human and machine analysts to detect anomalies and potential malware traffic easily.
Comparison to Other Process Attribution Software Products
We believe PAINT/Wireshark is one-of-a-kind, but there are a couple software products that partially achieve PAINT/Wireshark’s real-time TCP/IP process attribution and packet capture functionalities on the Windows platform: Network Monitor and Process Monitor.
- Microsoft Network Monitor (NetMon) is a free network packet capturing software from Microsoft. It looks up the TCB (TCP Control Block) in semi-real-time to attribute network packets to processes. It can, however, only attribute TCP traffic and not UDP traffic. Another NetMon limitation is that it only periodically queries the TCB due to performance constraints. It’s possible for a TCP connection to exist between the TCB polls and cause a false-negative.
- Process Monitor is another Microsoft (SysInternals) tool. It logs virtually all attributable application activities including network activities. However, it can only attribute network connection activity and does not capture the traffic content like PAINT/Wireshark or Network Monitor.
- On Linux, there is a tool that partially achieves what we are doing with PAINT, which is a program called NetHogs. It can attribute network traffic usage totals to individual processes, but it lacks the ability to attribute data at a per-packet level, and is limited to TCP only.
- On the Mac OS X platform there is Private Eye. It is a simplified and user-friendlier tool similar to Process Monitor. It does not attribute traffic at a per-packet level.
Event Tracing for Windows
Event Tracing for Windows (ETW) is a logging mechanism provided by Windows. It enables any user or kernel processes to log an event and lets any user or kernel processes subscribe to and receive events as broadly or as selectively as desired. Each ETW event contains an Activity ID that is used to perform a call trace within a single thread of control. ETW was first introduced in Windows 2000 and has been improving with subsequent Windows releases as more components of the system provide tracing information via ETW. PAINT/Wireshark requires the end-to-end ETW tracing information from the network stack components, which was first introduced in Windows 7.
Technical Overview
We identified three ETW providers built-in to Windows that gave us raw network packet capture, TCPIP events with PID, and a way to correlate the two: the Microsoft-Windows-NDIS-PacketCapture (referred to as “ETW-NDIS” henceforth for brevity), Microsoft-Windows-TCPIP (referred to as “ETW-TCPIP” henceforth), and Microsoft-Windows-Networking-Correlation (referred to as “ETW-Correlation” henceforth), respectively.
While both the ETW-TCPIP and ETW-NDIS events contain the Activity ID field, these fields cannot be correlated in the traditional ETW event correlation fashion because they occur in different OS threads. Thankfully the ETW-Correlation provider sends out Activity Transfer events that correlates the ETW-TCPIP Activity IDs to the ETW-NDIS Activity IDs. Correlating these events in real-time proved to be non-trivial as it originally seemed, and we believe there’s at least a small room for improvement in the correlation state-machine for both attribution and run-time performance.
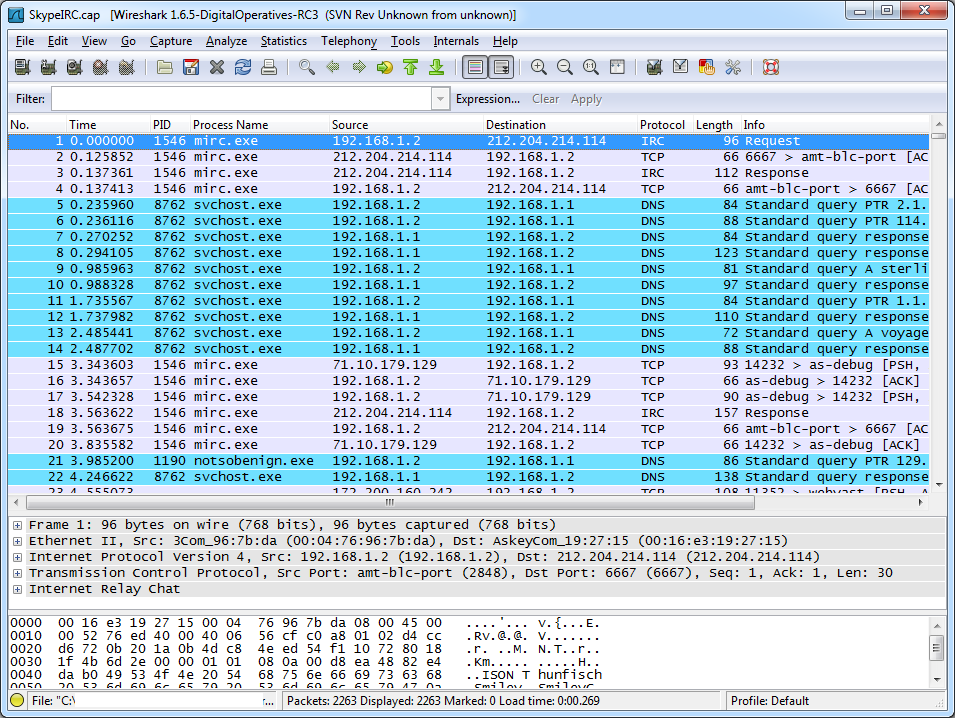
We modified Wireshark 1.6.5 to introduce PID and process name columns. We introduced a new binary file (.process) that pairs with the .pcap file. The current version of PAINT looks for the .process file whenever a .pcap file is opened and reads the process information to display (functions normally when it’s not found). We created our own dumpcap.exe implementation that replaces the original dumpcap.exe to provide the packet captures and the .process file using the ETW-NDIS provider.
Result
As you can see the result looks great! Process information seamlessly integrates into Wireshark 1.6.5 in real-time and file-open operation modes.
Performance wise, we believe we achieve 0% false-positive (no wrongly attributed traffic) and 0% false-negative (no missing correct attribution) rates for UDP traffic and 0% false-positive and ~20% false-negative rates for TCP traffic. Currently, we can attribute about 100 packets per second on a typical Core2 machine.
We plan on making our custom Wireshark code available so that other pcap/PID providers can follow the same design paradigm enabling network traffic process attribution in Wireshark. Wireshark is not affected by our code if the original dumpcap.exe is used.
Please inquire at contact -at- digitaloperatives -dot- com for more information. Also stay tuned for details on PAINT Enterprise, an enterprise tool enabling easy-to-manage whole network process attribution.
Process Attribution in Network Traffic (PAINT)